
Authors: Matthew Furlow, PhD, Associate Principal at ZS; Andreas Dimakakos, PhD, MBA, PMP, Director of Scientific Insights, Intelligencia AI; Evgenia Kyriakidou, Business Insights Associate, Intelligencia AI; Elpiniki Georgiou, PhD, Senior Data Analyst, Intelligencia AI;
Contributors: Joshua Hattem, Principal, R&D Advisory Lead, ZS and Panos Karelis, Director of Insights Excellence, Intelligencia AI
Key Findings
- Every month a program can accelerate to market adds an estimated $5-6M of net present value per billion dollars of peak year sales
- We have identified clinical development decisions that entail trade-offs in accelerating time to market and increasing likelihood of approval
- We have identified common clinical development decisions that have a relatively neutral impact on time to market and likelihood of approval
- We have examined skipping trial phases and aggregating trial phases, which have disparate impacts on time to market and likelihood of approval
Why Time to Market Matters in Oncology Drug Development
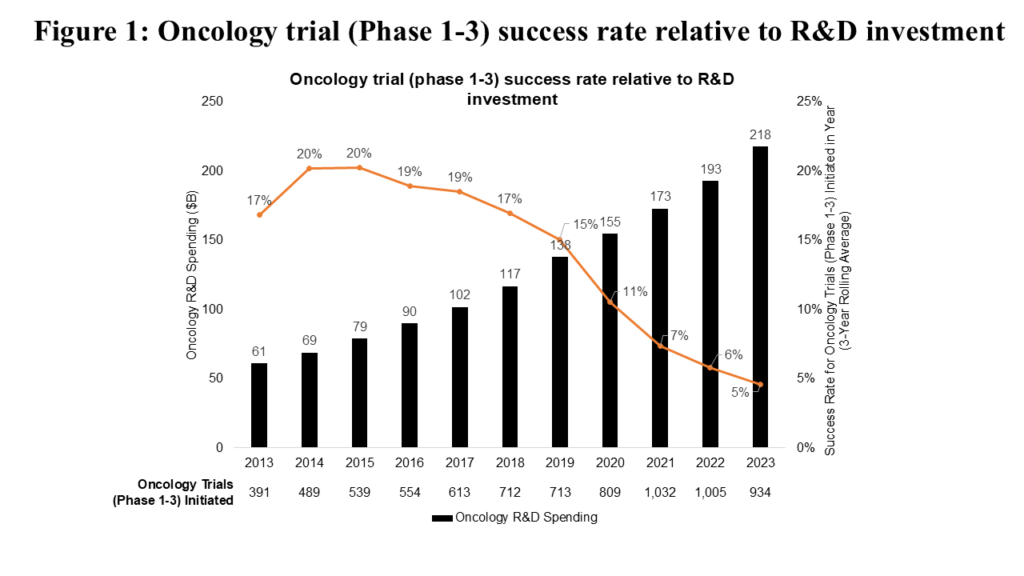
Innovation in oncology R&D has been driven both by advances in basic science (e.g., improved understanding of hallmarks of cancer) and steadily increasing biopharma R&D investment (see Figure 1). This growing investment has been justified by oncology’s position as a therapeutic area that offers an efficient path to marketable drugs, driven by high unmet need and relatively short development times.
However, efficiency of innovation in oncology R&D is becoming a challenge. Success rates for oncology clinical trials (Phase 1-3) have declined steadily from 2015 to 2023 (see Figure 1). Notably, the distribution of clinical trials by phase has remained relatively consistent over this period, meaning this decline can be attributed to declining clinical trial success rates.
Learn more about AI-driven oncology trial insights in our case study on clinical trial optimization.
There’s no debate regarding accelerating treatments and addressing unmet patient needs for cancer medicines. The more quickly and efficiently new cancer treatments are commercialized, the better the industry can address patients’ medical needs, as well as the financial and operational goals of optimizing R&D investment and return on investment. As an industry, we achieve these goals through strategic decisions that drive clinical trial design or sequencing, or operational decisions that define clinical trial execution once designed. This analysis focuses on the former, specifically on the following strategic decisions:
- Pursuit of accelerated approval: Seeking approval for drugs that target serious conditions and fill unmet medical needs based on surrogate endpoints.
- Use of surrogate endpoints (for regular approvals): Employing markers that have been proven (or are likely) to predict clinical benefits.
- Front-loading indication expansion: Initiating clinical programs to expand approved indications for drugs before they demonstrate clinical benefit in their initial registrational clinical trials.
- Study of patient subpopulations (as opposed to all-comers): Targeting focused subgroups (e.g., those defined by biomarker, risk status, age) rather than entire tumor types.
- Innovative program design – aggregation of trial phases (for regular approvals): Designing and running dual phase trials (e.g., Phase 1/2, Phase 2/3).
- Innovative program design – skipping trial phases (for regular approvals): Designing and running programs that omit a phase (e.g., initiating a Phase 2 trial in a specific tumor type without a Phase 1 trial dedicated to that tumor type).
- Choice of novel (rather than non-novel) clinical trial comparators: Comparing against a novel medicine (i.e., medicines other than chemotherapy and other generic cytotoxic regimens, radiotherapy, generic hormonal therapies, surgery, and placebo/observation/best supportive care).
The U.S. National Academies of Sciences, Engineering, and Medicine (NASEM) have identified most of these decisions as mechanisms to address inefficiency in cancer drug development. However, these decisions often involve difficult trade-offs between accelerating time to market and improving the probability of program success.
The industry often finds itself facing such trade-offs, as illustrated by Roche’s CEO, Dr. Thomas Schinecker, who said at the company’s 2024 Pharma Day:
“We have in fact made decisions in some cases to stop studies that we did not feel met the bar. One example was in the tiragolumab space. There were two—at least a couple of studies, including a Phase 3 trial that we terminated, because we didn’t feel like the aggregate evidence—emerging evidence justified that investment. So, certainly there are cases where ethically, it doesn’t make sense to stop Phase 3 studies midstream, but we are intentional about redirecting resources no matter where those resources are, if that is what the bar says to do.”
Methodology
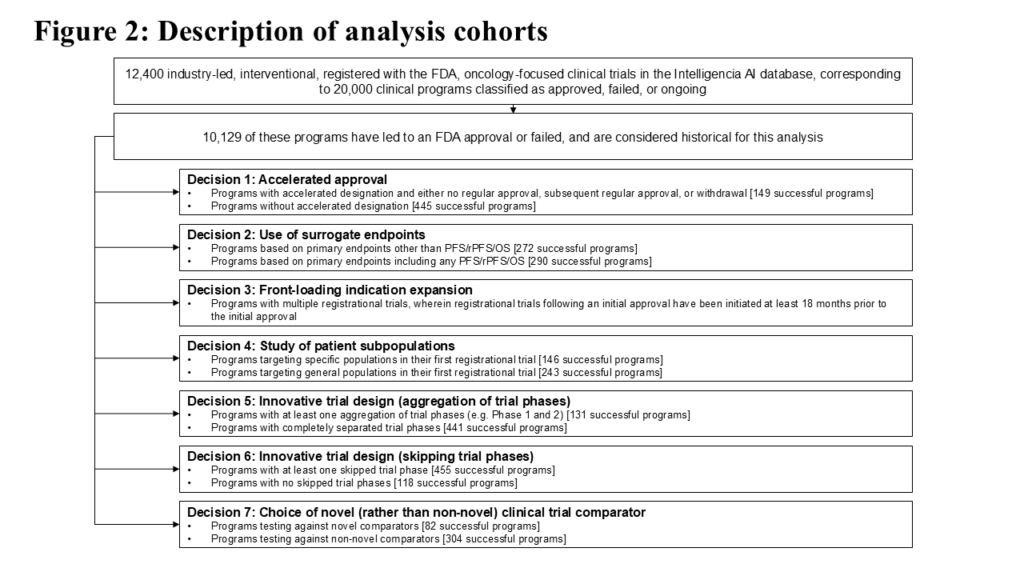
For this analysis we examined over 20,000 industry-sponsored interventional oncology clinical programs (around 12,400 clinical trials) included in Intelligencia AI’s proprietary database. We further focused on a subset of 10,129 programs that were completed (“historical”) and resulted either in approval (regular or accelerated) or discontinuation. These historical programs were further classified according to the seven strategic decisions described earlier.
Details of historical trial cohorts corresponding to each strategic decision are described in Figure 2.
Executive Summary
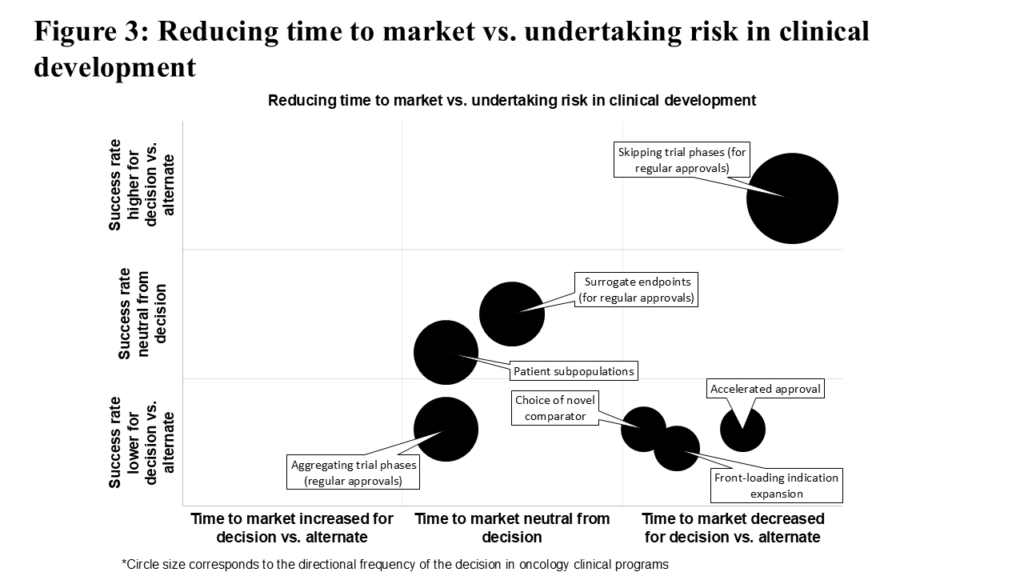
To evaluate each of these strategic decisions, we assessed their association with time to market and historical success rate. The results are summarized in Figure 3. Consistent with the theme of difficult trade-offs, decisions to pursue accelerated approval, test against a novel comparator, or front-load indication expansion are high-risk, high-reward. Clinical programs using these decisions on average reach the market quicker than comparable programs not employing such strategies, though their success rates demonstrate a consequent decrease. Unsurprisingly, these high-risk high-reward decisions are less common.
Using surrogate endpoints (in pursuit of regular approval) or testing within patient subpopulations are relatively more common decisions with a neutral observed effect on time to market and historical success rate. Aggregating trial phases (in pursuit of regular approval) is surprisingly common, despite slightly increasing time to market and adding risk compared to keeping the phases separate.
By contrast, skipping trial phases (in pursuit of regular approval), the most common decision in this analysis, significantly reduces time to market while also improving historical success rate relative to not skipping trial phases. The following sections provide detailed insights into each strategic decision.
1. Decisions Requiring Difficult Trade-offs
With high-risk, high-reward strategic decisions, we find that accelerated approvals, testing against novel comparators, and front-loading indication expansion require difficult trade-offs, since they lead to lower success rates than their alternatives, but that each are associated with shorter time to market.
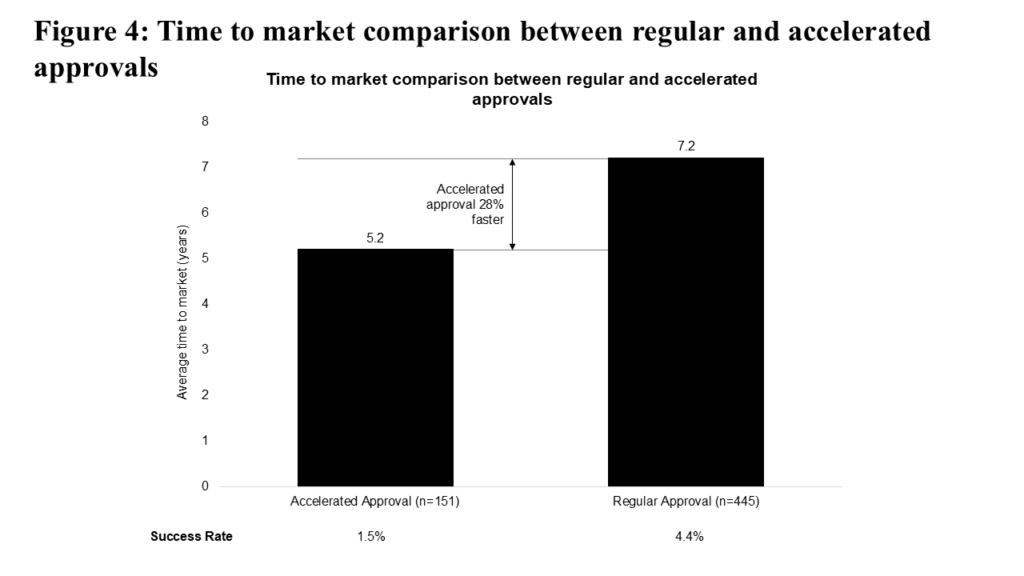
Accelerated approvals, first instituted by the FDA in 1992, have historically reduced time to market for oncology drugs by 28% compared to regular approvals (see Figure 4). However, for trials started in the past five years, this time-saving advantage has decreased to 18%. This decrease is due in part to increased scrutiny around accelerated approvals; since 2020, taking into account the 2021 Oncology Drugs Advisory Committee (ODAC) review of dangling checkpoint inhibitor approvals and the impact of Project Confirm, 13 accelerated approvals have been withdrawn. The accelerated approval approach also carries additional risk: programs pursuing accelerated approval have historically shown a lower success rate compared to programs pursuing regular approval (1.5% vs. 4.4%).
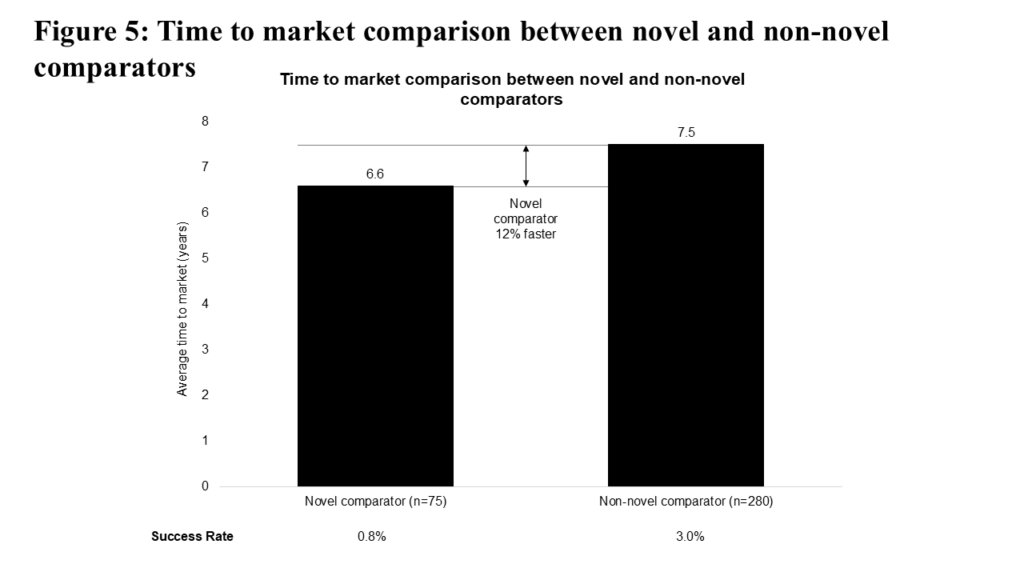
The choice of comparator in a clinical trial is less “flexible” given the need to demonstrate benefit against a standard of care. Still, one would expect that choosing a novel comparator could increase time to market, given the increased “bar” to cross for clinical evidence. Figure 5 illustrates that comparing vs. novel medicines is associated with decreased time to market, but with a lower success rate (0.8% vs. 3.0%). This particular difference may be attributable to a greater proportion of novel comparator programs focusing on advanced/metastatic (and further, later-line advanced/metastatic) patient populations relative to non-novel comparator programs (where we see proportionately more local/regional and first-line advanced/metastatic patient populations).
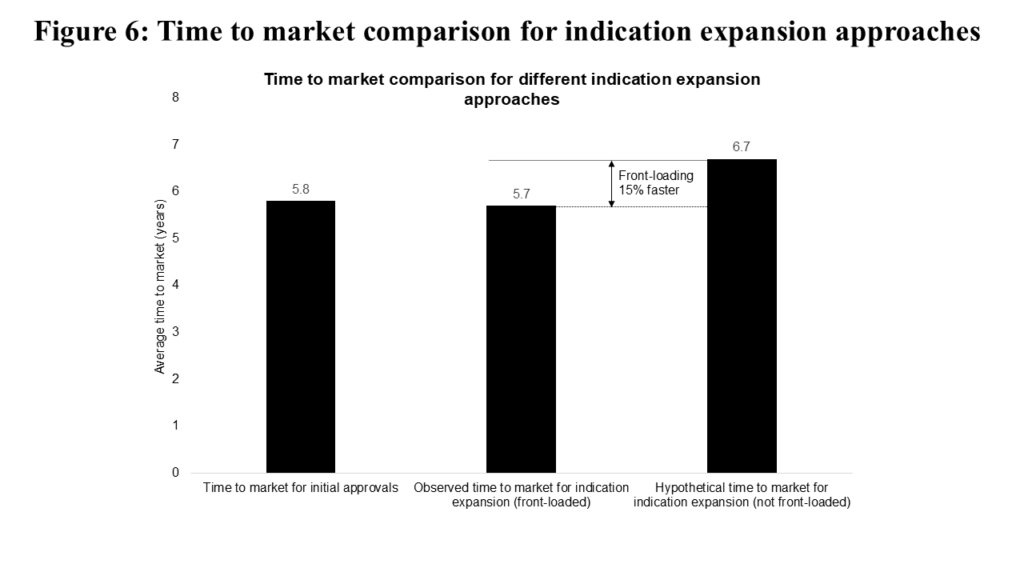
The final “risk vs. reward” decision we studied is front-loading indication expansion. Interestingly, the vast majority of second indications (following an initial “parent” approval) for a given asset come within the “front-loaded” period described above. Accordingly, we must simulate what “non-front-loaded” programs would look like. We observe in Figure 6 that second indications initiated in the “front-loaded” period reach market in very similar timeframes as initial approvals (5.7 vs. 5.8 years).
If we further model “front-loaded” programs shifting into the “non-front-loaded” window, time to market increases by one year (to 6.7 years, making front-loading 15% faster). While there isn’t a basis of comparison for success rates between “front-loaded” and “non-front-loaded” decisions, programs successfully achieving multiple approvals are quite rare, with historical programs achieving a 1.0% success rate.
2. Decisions With Neutral Impact
Here, we explore strategic decisions with a “neutral” impact on both time to market and success rate when compared to their alternatives. Given their prevalence in oncology, insights around these decisions can help shape realistic expectations regarding time to market and the likelihood of success for programs implementing these decisions.
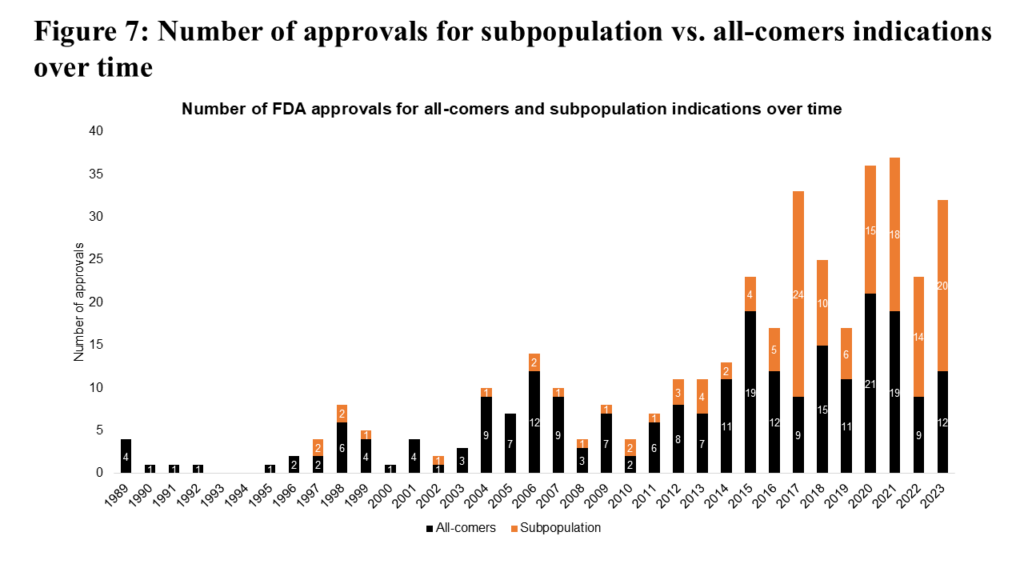
Focusing first on the study of patient subpopulations, we observe a significant shift over the past decade. Historically, the majority of FDA oncology approvals were for all-comers populations (see Figure 7). However, in the past 10 years, approvals for patient subpopulations have risen sharply, nearly matching those for all-comers. This trend highlights a paradigm shift toward precision medicine.
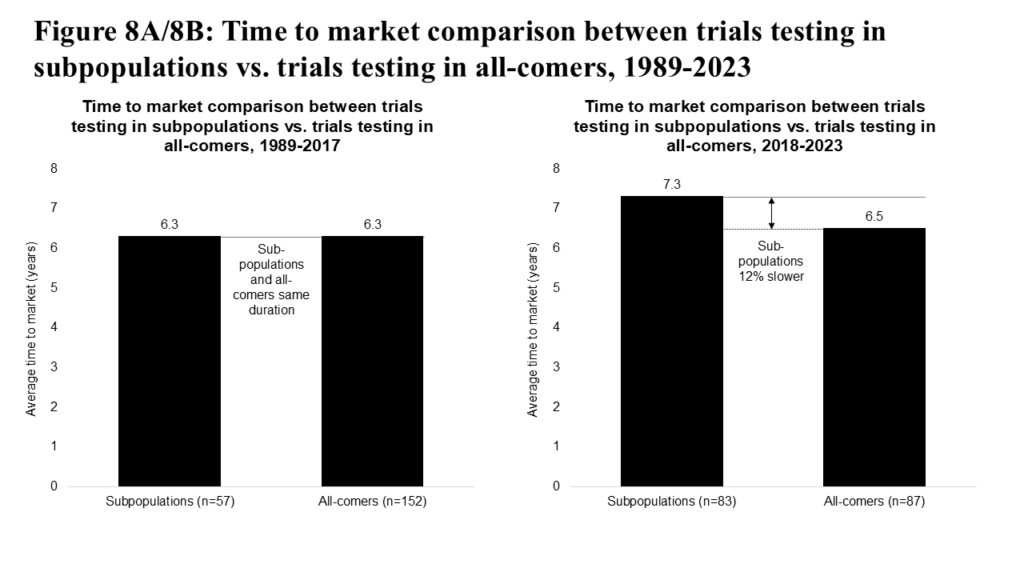
Testing medicines in subpopulation indications has historically shown a neutral to slightly slower time to market (see Figure 8A). But in the past six years, subpopulation approvals appear demonstrably slower to market (see Figure 8B), reflecting both increased relative investment in subpopulation indication trials and associated advances in treating subpopulations (e.g., second- and third-generation targeted inhibitors in non-small-cell lung cancer). The subpopulation approach also carries some risk, with a historical success rate of 1.4% (reflecting higher unmet needs and patient types that are more difficult to treat), relative to 2.4% for all-comers programs.
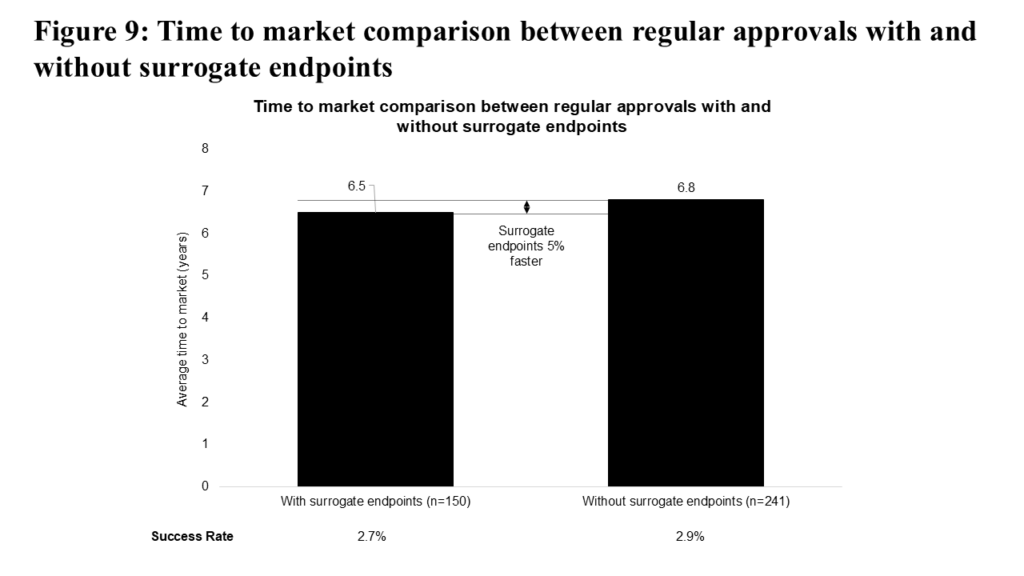
Surrogate endpoints have been used extensively to support accelerated approvals. To explore their role further, we examined the use of surrogate endpoints in regular approvals. As shown in Figure 9, surrogate endpoints are associated with a modest (5%) decrease in time to market for regular approvals, while their impact on success rates remains small (2.7% vs 2.9%).
The potential of surrogate endpoints to accelerate access to new medicines, particularly in indications with extended overall survival, has driven ongoing research to strengthen the evidence supporting their use. Most recently, the FDA Oncologic Drugs Advisory Committee (ODAC) unanimously voted in favor of authorizing Minimal Residual Disease (MRD) testing as a surrogate endpoint in multiple myeloma.
3. Decisions on Aggregation vs. Skipping a Phase
For the final part of our analysis, we examined a pair of decisions with disparate impacts.
1. Aggregating trial phases, while common, appears less successful than running distinct trial phases; and
2. The common decision to skip a clinical trial phase appears relatively successful.
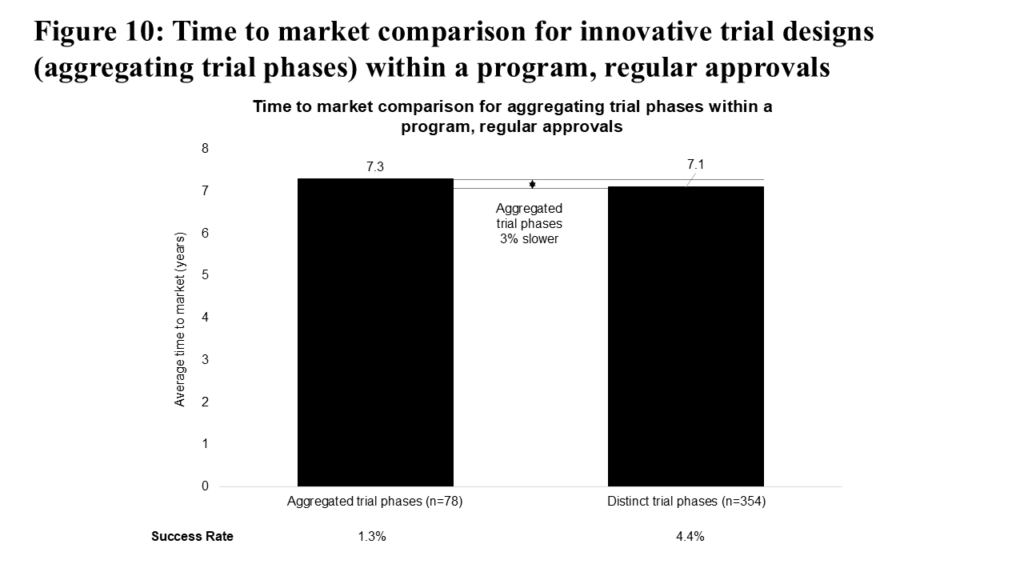
We expected that aggregating trial phases in a clinical program would reduce time to market, due to the lowered operational requirements of running a single trial instead of two. This acceleration is particularly evident for Phase 1 and 2 trials, where aggregated Phase 1 and 2 trials are, on average, 23% faster compared to a sequential Phase 1 to Phase 2 approach (5.0 vs. 6.5 years).
However, Figure 10 shows that across the entire drug development timeline, aggregating trial phases is associated with a slightly slower time to market relative to following the complete phase path, and also results in a lower success rate (1.3% vs 4.4%). Our interpretation is that the initial acceleration of time to market for programs with aggregated trial phases is ultimately offset by factors such as increased FDA scrutiny or coordination requirements, more complex statistical considerations, the need to reassess dosing regimens, or undisclosed decisions by program sponsors to delay certain stages. Despite the limited overall benefit, this strategic approach remains a common practice in oncology clinical development.
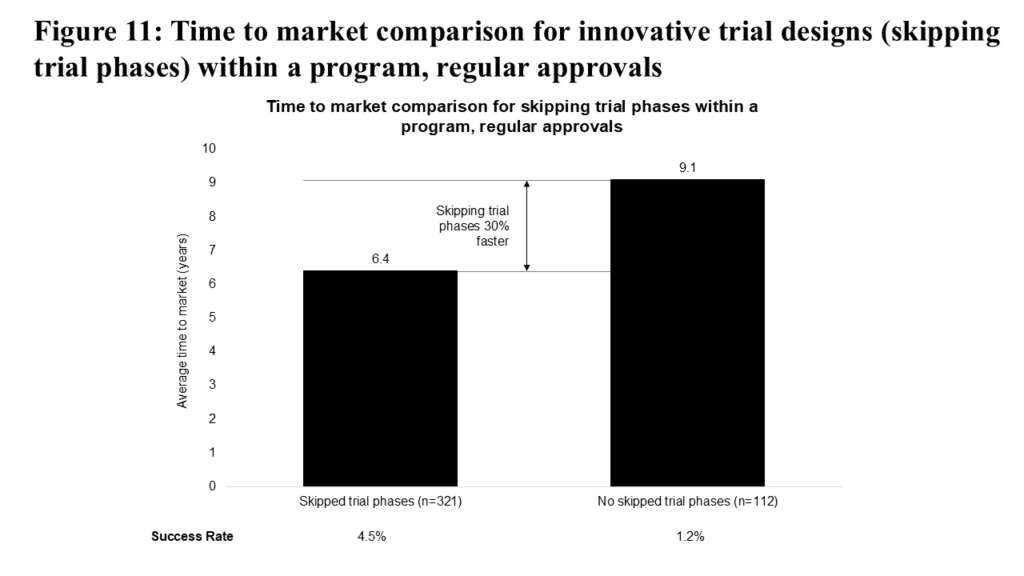
Similarly, we expected that skipping an entire phase of a clinical program would lead to a significant decrease in time to market, which is confirmed in Figure 11. This approach additionally increases the success rate (4.5% vs 1.2%) compared to not skipping trial phases.
This strategic decision is understandably the most common among those we analyzed, and its most common form is to skip a dedicated Phase 1 trial for a specific tumor type and proceed directly into Phase 2, likely leveraging knowledge of potential efficacy and optimal dosing from other studies and/or approved indications. This specific approach, and the associated de-risking of clinical programs, may also partly explain the observed benefits to success rates.
Putting Our Findings Into Perspective
The oncology sector and the patients it serves continue to face a significant unmet need for new treatments, while biopharma companies are under pressure to deliver returns from growing R&D investments. Setting aside competitive dynamics, each month a program can accelerate to market adds an estimated $5-6M of net present value per billion dollars of peak year sales. Competitive dynamics, such as reaching the market before an in-class competitor, could amplify this impact. This makes strategic decisions like those described above financially impactful, especially for potential blockbusters and mega-blockbusters.
We have found that while accelerated approval can be useful in accelerating time to market, it is not a panacea, as it results in a lower success rate compared to regular approvals. Moreover, as the benefits of accelerated approval in reducing time to market have diminished over time, and scrutiny around confirmatory trials intensifies, sponsors will need to carefully select programs for accelerated approval. Sponsors should focus on high unmet need indications and/or treatments that offer clinical benefit that far surpasses the standard of care.
Understanding the Financial Impact
We have also learned that while novel comparators may add risk to a program, they don’t appear to impact time to market significantly (in aggregate and at present). However, as programs in local/regional or early advanced/metastatic settings start to test more against novel comparators, we may start to see time to market align more closely with programs using non-novel comparators. Since choice of comparator is often more constrained by clinical guidelines and standard of care, these findings can help set expectations for such comparisons when they are required.
For medicines with multi-indication potential, we find that front-loading indication expansion is associated with reduced time to market. While this decision does carry some risk to the success rate, the risk is comparable to other strategic decisions in this analysis. As such, it represents a promising strategy for medicines targeting multiple tumor types.
Analyzing approaches with a relatively neutral impact on both time to market and success rate, we find first that testing a medicine in patient subpopulations should be guided by the medicine’s specificity (e.g., to a mutation, cell-surface antigen or risk signature) rather than being applied as an overarching strategy.
The Role of Surrogate Endpoints
For surrogate endpoints, while we find that there is a neutral impact in aggregate for regular approvals, there remains significant potential to reduce time to market for programs pursuing early-stage cancers and/or chronic malignancies like multiple myeloma or chronic lymphocytic leukemia. Considering their relatively neutral impact in aggregate, these approaches should be reserved for situations where they make strategic sense, based on the nature of the product and target indication.
Skipping vs. Aggregating Trial Phases: Which Works Best?
Aggregating or skipping trial phases are both common strategic decisions. Skipping trial phases, however, is a safer and more effective means of reducing time to market than aggregating clinical trial phases. However, it also seems to be an “open secret” within the industry, as evidenced by being the most common strategic decision in this analysis.
Moreover, since Phase 1 trials dedicated to specific tumor types are most frequently skipped, this decision is likely most suitable for programs that have already undergone more advanced development in other indications, where clinical activity and dosing have already been established. While this approach appears promising, it should be noted that the FDA imposes higher requirements for approval of this and other adaptive design approaches, which are more easily implementable for subsequent indications where clinical activity is better established. Additionally, the FDA’s Project Optimus program may complicate this strategy’s use by requiring more robust dosing data for specific tumor types, which decreases the utility of Phase 1 basket trials. On the other hand, aggregating trials shows some benefit in accelerating early-phase clinical program development. These aggregations must be planned both with the FDA and within the context of the entire clinical program to ensure that time savings realized in early phases of development lead to overall time to market reduction.
Final Thoughts: Navigating the Trade-offs
Even though no individual strategic decision can guarantee success on its own, shaving even a few months off a program’s time to market can be highly valuable. Our analysis highlights the need and opportunity for sponsors to consider these strategic decisions and their potential impact, both before initiating and during oncology clinical programs, in order to chart the best course to market.